Member Analytics
An actionable spend and savings log
Product purpose
Background: HealthTrust's core business model is centered on data collection from multiple sources. They started the process of moving their data off the MicroStrategy platform to enable their member base to have easier access to their own data, no longer relying on an account partner, and saving themselves money.
Problem: Three disparate systems housed analytics data, most of which members could not directly access. This ultimately limited their view of spend data and increased member distrust, as the data was often inaccurate.
Business Goal: Increase savings through a unified total non-labor expense analytics platform.
Product Goal: Enable the HealthTrust membership to access and manage their supply expense-related spend by giving them better indicators of where to take action, rebuilding member trust, and limiting the number of data access points to reduce user friction.
My Product partner and I had a kick-off with the VP of Finance to uncover how analytics worked at HCA.
We uncovered that most hospitals don’t have access to HealthTrust’s analytics tools and instead depended on either asking their account rep to give them access to reports or downloading raw data to make their own.
Where I started
My product manager and I worked together on research plan to identify:
What existed today
How was analytics actively being leveraged
Discovery interviews
What we did
We conducted 10 discovery interviews with Facility, Division, and Corporate level Supply Chain roles at HCA.
What we learned
There's an excessive amount of manual work done to solve the supply expense puzzle.
Data inconsistency is the crux of user problems.
Institutional knowledge isn't equally distributed enough for everyone to make required decisions.
Benchmarking would only be successful when Facilities and Divisions could see comparable data.
There are multiple places to run reports and look for data, like MicroStrategy, PowerBI, and the Member Portal.
Gaining VP buy-in
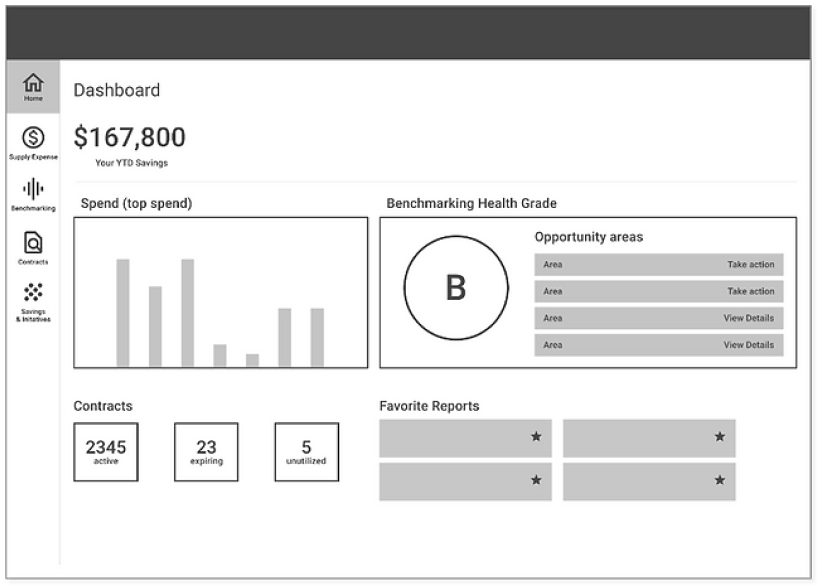
My Product partner and I shared our findings with the VP. I included a very rough mock-up of the UI to get their buy-in, and we outlined the following as our next design steps.
Surface opportunities for spend improvements
Track spend when pursuing savings opportunities
Show how opportunities and other decisions affected their bottom-line: realized savings
Compare their spend to (many) similar cohorts
Team workshop
Confident with our approach, we took our findings to the larger team and had a kick-off workshop to ideate the main problem areas to get team buy-in, as well as to create our future OKRs. View workshop here.
(Trust me, you want to view it)
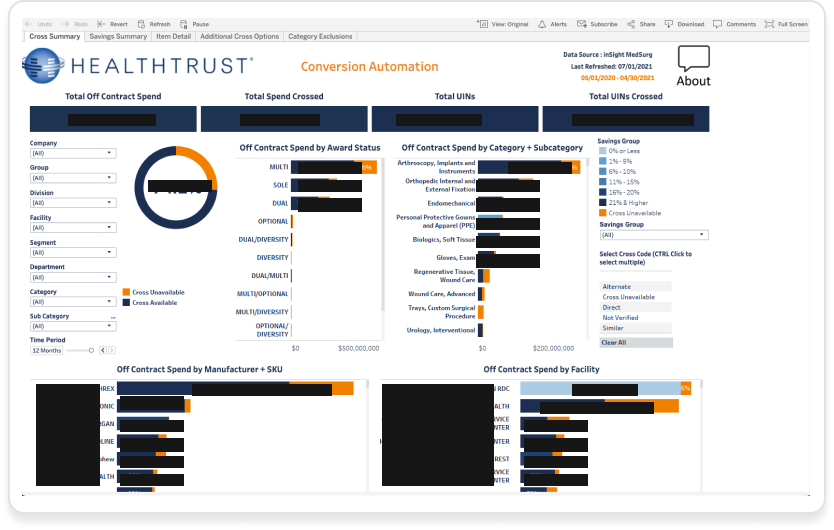
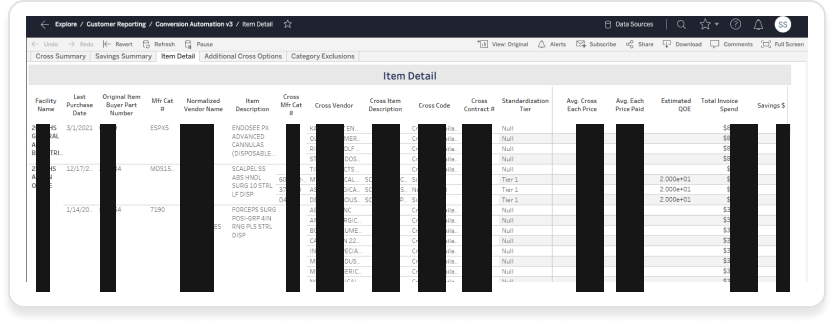
After the workshop, I leveraged other ideas about an analytics dashboard, leading us to our first prototype which combined 4 different reports (see images to the right) with multiple drilled-down views.
Usability testing
After creating the prototype, we embarked on a second round of research. We reached out to the original participants, as well as nine new ones who worked at various sized HCA-owned hospitals across the US, with varying titles at the Division and Facility level.
Key Research Questions
Could our participants use this dashboard to obtain the information they needed?
Is the information we display aligned with how they look at data?
What, if anything, is missing?
What we learned
Not all roles, from Corporate to Facility, had the same interest in what displayed, so we'd need to adjust it based on roles, especially in the initiative creation.
Viewing data by date and date range is essential, but an implied lack of trust in the data's accuracy lingered.
The titles we used under “Top Opportunities” wasn’t as clear to folks, such as “[X] items purchased through the wrong channel” - was preferred to see “Right Item, Wrong Channel”
There was some information in our expandable rows that we didn’t include that needed to be included
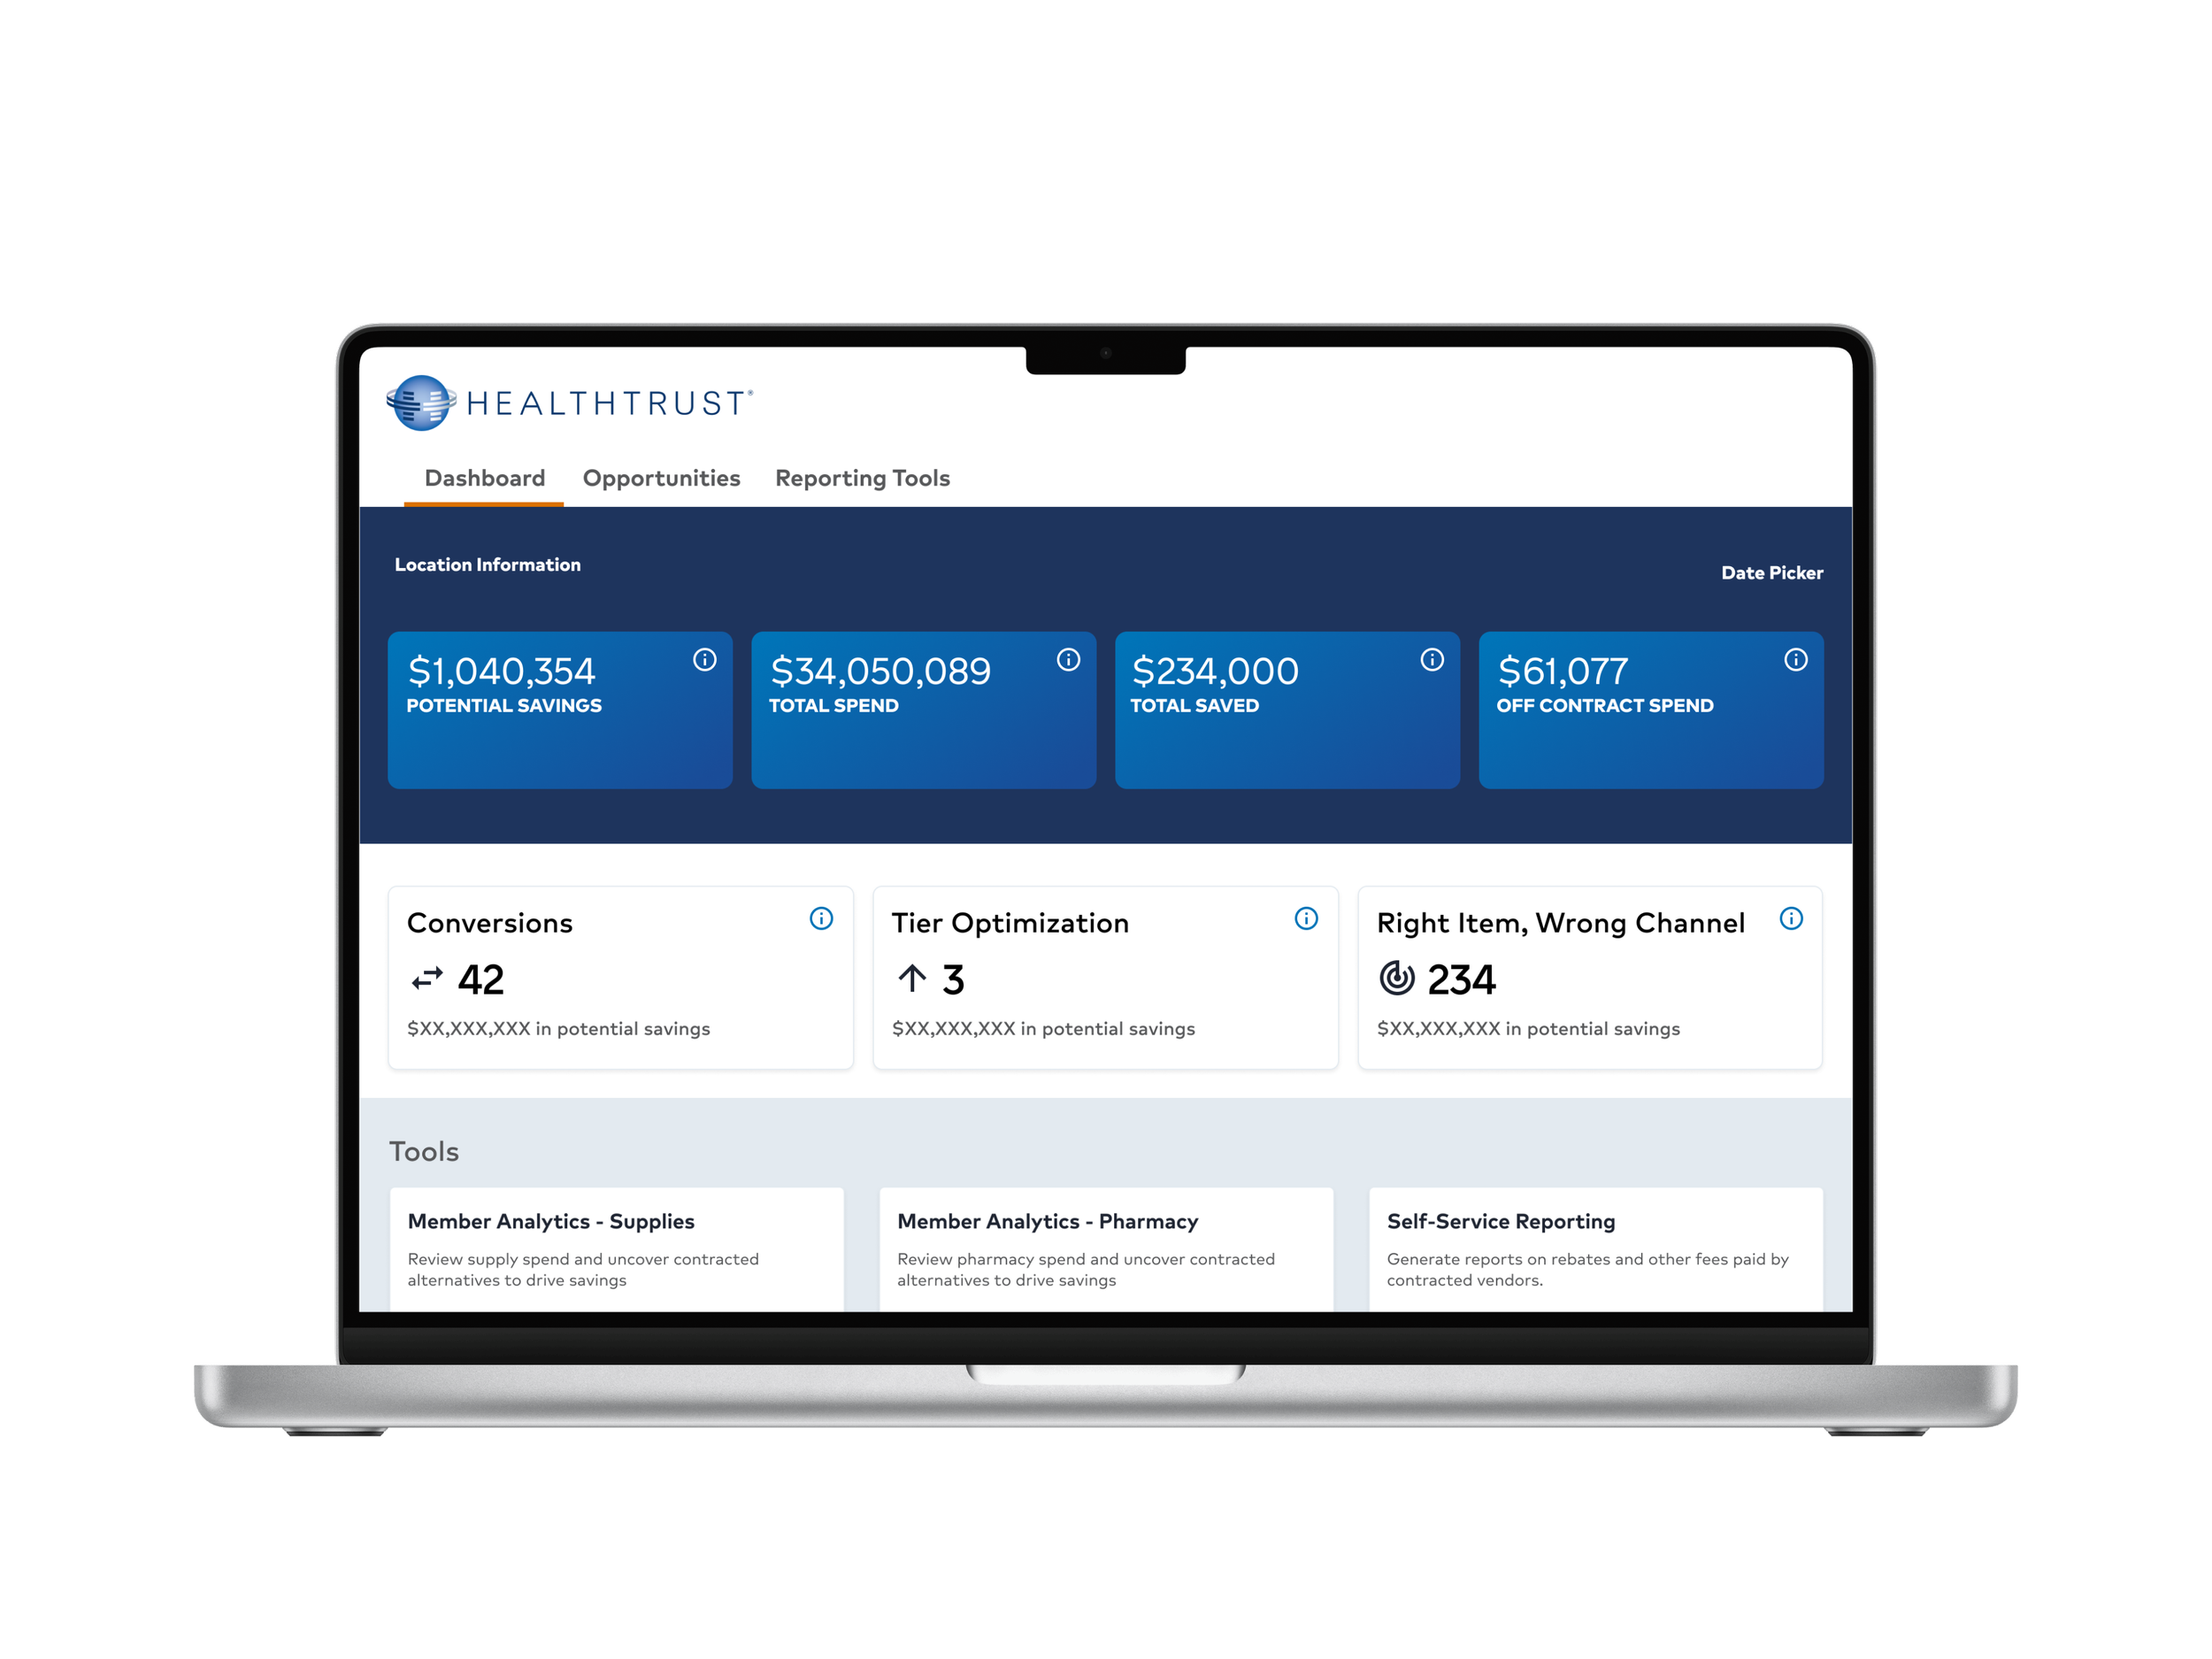
Product evolution
After synthesizing the testing data with my Product partners, we started building a pilot experience, working closely with our Engineering and Data teams for future implementation.
We also worked cross-functionally with our Member Portal team on analytics access and display for the new portal.
The experience shown below, shows how the Analytics product evolved with an updated UI and new skin, which set the direction for the entirely new Member Portal.